Intro
The 2013 edition of Power Statistics and Trends presents a comprehensive and independent analysis of the European electricity sector, based on the latest available data from 33 EURELECTRIC member countries. It provides an overview of the most relevant factors shaping the present and future of the European electricity sector.
Power Statistics and Trends 2013 highlights the most significant developments in the period 2010-2012 and provides an outlook of major trends up to 2030. The full report also includes data from 1980, 1990 and 2000, enabling a view of the electricity sectors evolution over three decades.
Integrated thematic coverage includes policy, economic, technology and environmental areas, providing a comprehensive graph of current issues and expected trends.
*Click on the graph to enlarge
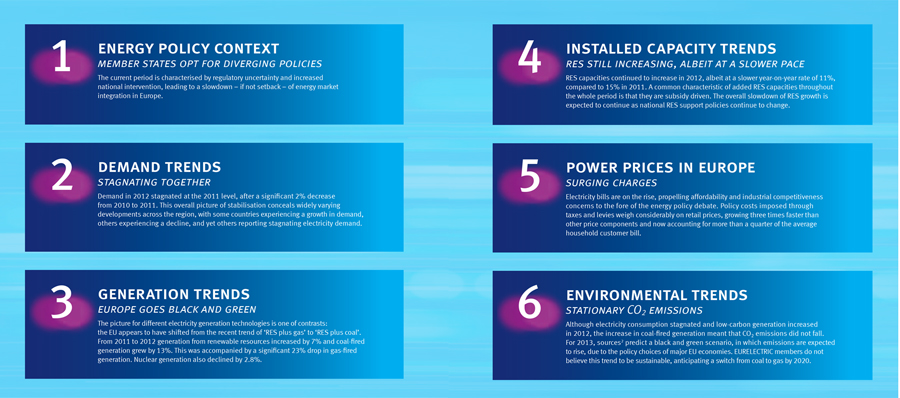
Energy policy context
The environment for European utilities has been difficult throughout the reporting period. Nevertheless, there have also been some positive signs, for instance a new concern in Brussels with costs and competitiveness, with markets and fragmentation. The innovation agenda for energy is being reconsidered; research and development policies are likely to be freed from their current isolation and better integrated into general energy policy.
On the downside, regulatory uncertainty - both on national and EU level - has severely impacted all generation technologies, including also RES.
The following map reveals that as many as 13 EU member states have opted for retroactive changes or moratoria to their RES support schemes.
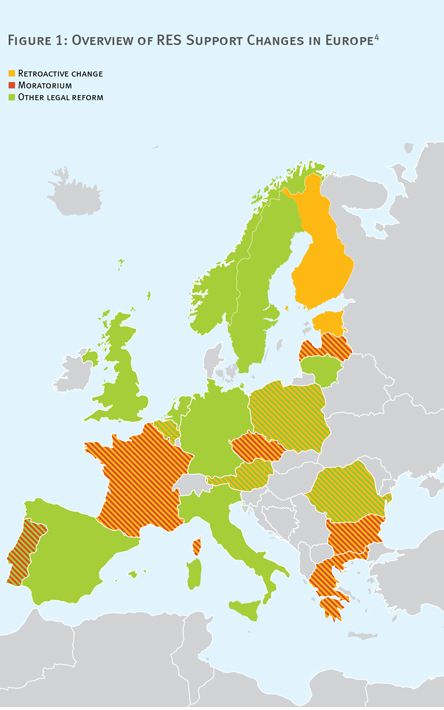
*Click to enlarge
Demand trends
After years of highly volatile evolution, EU-27 demand in 2012 stabilized at the 2011 level. However, overall stagnation conceals diverging country development patterns. Some countries experienced an increase in electricity demand, most notably Bulgaria (9,8%), Latvia (6,9%) and Malta (4,5%) while countries such as Belgium (-8,5%), Cyprus (-8%) reported a large decrease. The EU's bigger economies also show diverging demand evolution. Germany, Italy, the Netherlands and the United Kingdom reported contractions exceeding 2%. Demand in Spain and Poland fell by more than 1%, meanwhile France and Sweden reported increases.
Demand forecast 2020
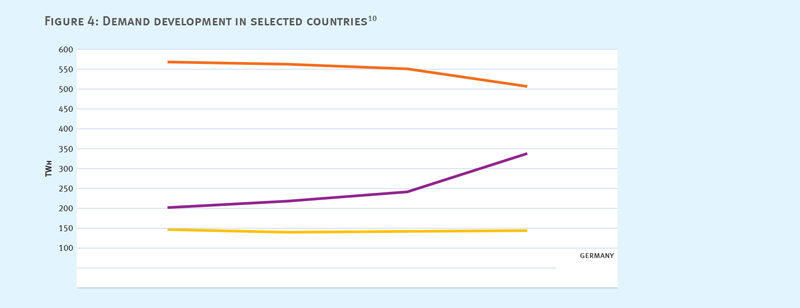
Demand for the EU-27 is estimated to grow from 3081 TWh in 2010 to 3250 TWh in 2020 at an annual growth rate of 0.5%.
The graph displays typical demand development patterns in selected EURELECTRIC member countries. While demand is expected to fall by 1.8% p.a. in Germany, it is predicted to stagnate in Sweden, with a marginal increase of 0.13% p.a. in the observed decade. Turkey is forecasted to see an annual increase of almost 3%. Germany and Turkey have been reporting demand development trends in line with the 2020 predictions since 2010.
Demand evolution patterns are expected be highly divergent across countries in Europe.
*Click to enlarge
Generation trends
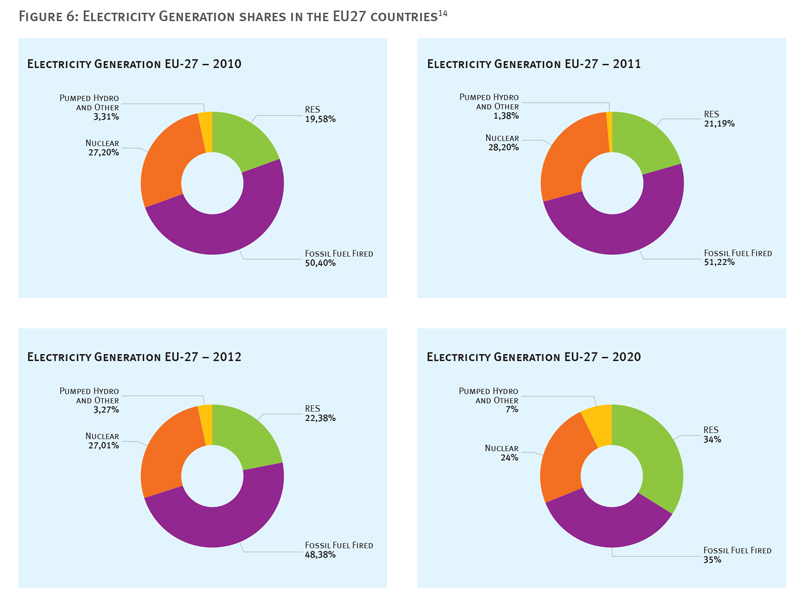
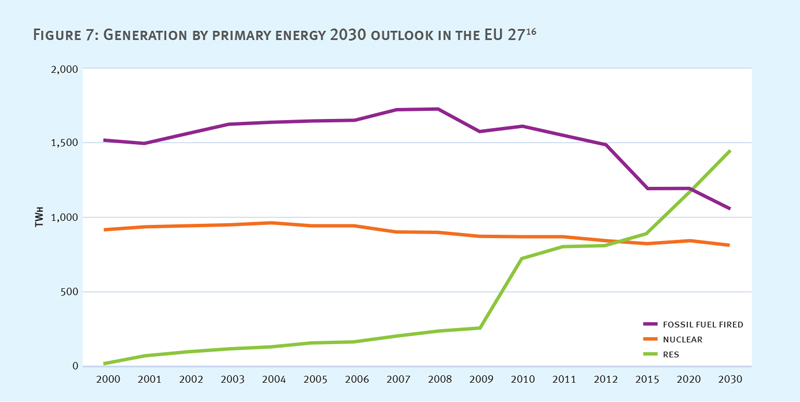
Total generation in the EU-27 marginally increased in 2012, after a remarkable decrease of 5% in 2011. Renewable based generation accounted for 22,3% of the electricity fed into the grids of the European Union in 2012, a year-on-year increase of 7%. By the end of the decade renewables are predicted to be the second largest component of the EU energy mix, accounting for 34% of the total generation.
Fossil fuel fired generation decreased by 4% in the same period and made up less than half of total generation for the first time in the history of EU. Natural gas-fired power generation accounted for the lion share of the reduction, decreasing by 23% (or 165 TWh).
The significant drop in the use of gas for electricity generation occured mostly to the benefit of coal market shares. While generation by all conventional technologies decreased, coal-fired generation by 13% (or 70 TWh).
*Click to enlarge
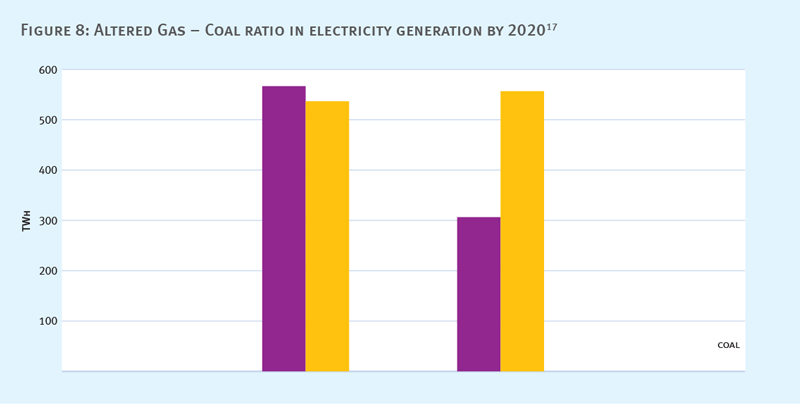
Assumptions by EURELECTRIC members regarding the role of coal and gas in the energy mix of 2020 are especially noteworthy in the light of the on-going gas to coal ?. They expect to ratio between coal- and gas-fired generation to shift to 1:1.8, with 307 TWh of coal- and gas-fired generation in the EU-27 in 2020.
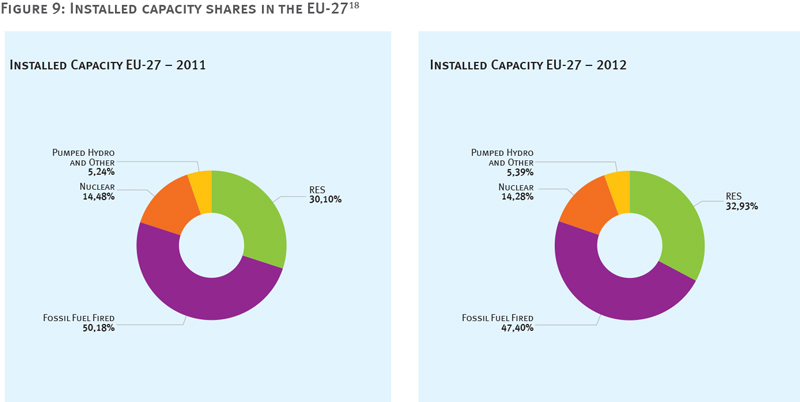
The share of renewable energy totaled 32.9%, an increase of 2.8 percentage points compared to 2011. Installed RES capacity grew most prominently in Italy (+15%) and Germany (+14%).
*Click to enlarge
Installed capacity trends
Between 2011 and 2012, installed capacity increased by 2% throughout the EU. Unsurprisingly, renewable technologies accounted for the full increase, as installed fossil fuel fired capacities fell by 3%, nuclear capacities marginally decreased and installed RES capacities grew by 10%.
*Click to enlarge
Power prices in europe
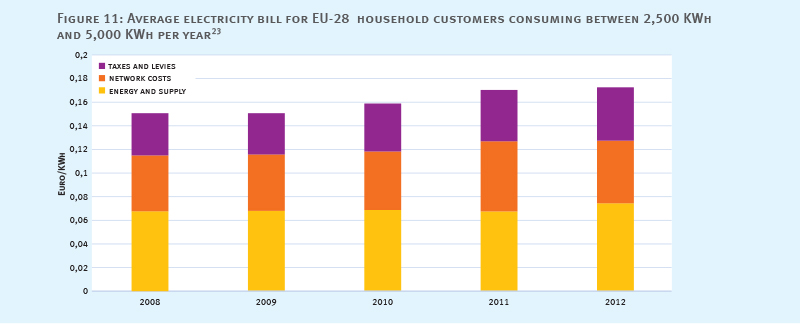
Taxes and levies increasingly weigh on power bills, growing faster than any other price component. 2013 will be remembered as the year during which affordability and competitiveness were propelled to the fore of the energy policy debate. Surging bills, electricity price freezes or price brakes have become commonplace in the lexicon of policymakers, industry representatives and citizens alike.
Household bills are on the rise. While public opinion often assumes that Europe's utility companies must be overcharging their customers, data from the Commission's statistics office Eurostat21 show that electricity companies are not the prime culprits
*Click to enlarge
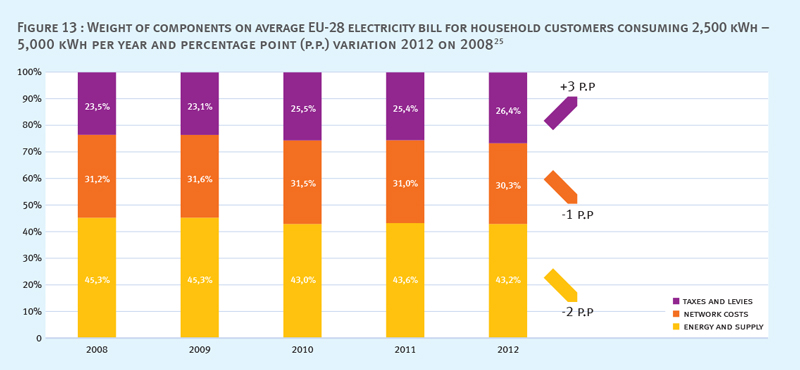
While the EU-28 average increase stood at 29%, some member states actually experienced significantly larger rises of the tax component. Among those, the biggest increase was recorded in Latvia (394%), followed by Portugal (108%), Greece and Estonia (both at 82%), Romania (80%), and Spain (74%).
*Click to enlarge
Environmental trends
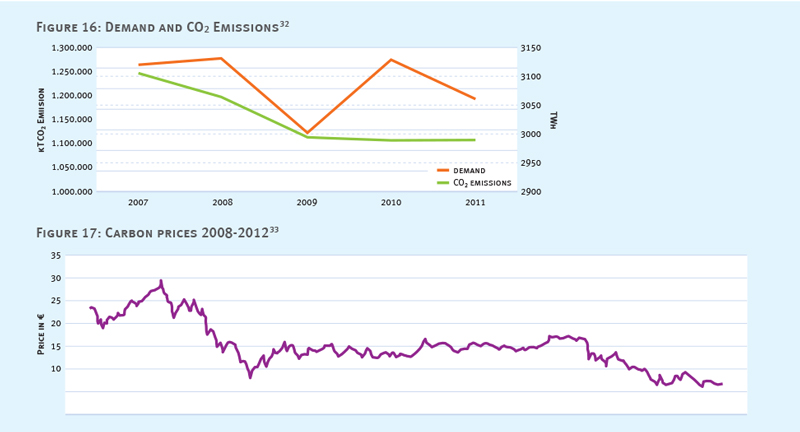
Although total electricity consumption fell by 2% in 2011 and it remained constant in 2012, the increase in coal-fired generation meant that CO2 emissions failed to fall correspondingly.
EURELECTRIC is concerned that RES support schemes, that were introduced to achieve the EU's 20% RES target, are undercutting the CO2 price. Such an effect increases the costs of the transition to low- carbon electricity, while having no diminishing impact on emission values. Historic data shows that, increasing RES generation was closely accompanied by increase in unabated coal-fired generation.
Disturbances in February 2012 highlighted the level of interconnectedness of electricity and gas supplies in the region. Stable gas supplies were critical to maintain the stability of power systems.
*Click to enlarge
Energy community trends 2010-2012
Power Statistics and Trends extends its analysis to the EU neighbouring area, most notably to the Energy Community, by displaying significant trends in the region. EURELECTRIC's Energy EU Neighbourhood network of experts aims to further strengthen cooperation and provide comprehensive insights
Electricity demand, much like in the European Union is characterised by stagnation in the period 2010-2012, indicating that effects of economic crisis are still present. The very modest increase in installed generating capacities can be primarily attributed to the rehabilitation of existing power plants and the commissioning of several small - scale renewable projects.
Indigenous generation of electricity was highly affected by weather conditions in 2011. Extremely unfavourable hydrology conditions were reported. Record low levels in hydro power reservoirs and low run-of-river hydro power plant inflows were recorded.
Disturbances in February 2012 highlighted the level of interconnectedness of electricity and gas supplies in the region. Stable gas supplies were critical to maintain the stability of power systems.
RES
The RES Directive (2009/28/EC) was adopted within the Energy Community following the decision of the Ministerial Council. Contracting Parties accepted binding RES targets for 2020.
Energy efficiency: Energy Community seven times more energy intensive than the EU average!
The Energy Community on average is approximately seven times more intensive in primary energy (0.83 toe/1000 USD) than average EU-27 (0.12 toe/1000 USD). This is mainly due to the ageing energy infrastructure, transmission and distribution energy losses, and low energy efficiency in the end-use sector. On the other hand, the Energy Community consumed less energy per capita (1.38 toe/capita) than the EU-27 (2.38 toe/capita. All Contracting Parties committed to energy savings targets of 9% of their final energy consumption by 2018 over a nine year period starting in 2010 through their respective National Energy Efficiency Action Plans.

*Click to enlarge